PM2.5 (μg/m³) | Web Scraping Tool | ScrapeStorm
Abstract:PM2.5 refers to airborne particles with an aerodynamic diameter of 2.5 micrometers or less, also known as fine particulate matter or respirable particles. ScrapeStormFree Download
ScrapeStorm is a powerful, no-programming, easy-to-use artificial intelligence web scraping tool.
Introduction
PM2.5 refers to airborne particles with an aerodynamic diameter of 2.5 micrometers or less, also known as fine particulate matter or respirable particles. PM2.5 concentration, measured in micrograms per cubic meter (μg/m³), is a core indicator for assessing air quality. Due to their small size and large specific surface area, PM2.5 particles can remain suspended in the air for extended periods, carrying harmful substances such as heavy metals, polycyclic aromatic hydrocarbons (PAHs), bacteria, and viruses. These particles can penetrate deep into the alveoli and even enter the bloodstream, causing severe damage to the respiratory and cardiovascular systems. The World Health Organization (WHO) classifies PM2.5 as a Group 1 carcinogen. China’s “Ambient Air Quality Standards” (GB 3095-2012) set the Grade II annual average concentration limit at 35 μg/m³ and the 24-hour average limit at 75 μg/m³. PM2.5 concentrations are influenced by multiple factors including meteorological conditions (wind speed, precipitation, temperature inversions), emission sources (industry, transportation, dust, biomass burning), and geographical environment. It serves as a critical basis for measuring atmospheric pollution levels and assessing public health risks.
Applicable Scene
PM2.5 concentration measurement and assessment are widely applied across environmental air quality monitoring and heavy pollution early warning systems, public health and epidemiological research, air pollution control policy formulation and effectiveness evaluation, indoor air quality monitoring, personal health protection guidance, industrial emission compliance verification, and urban planning and traffic management—environmental agencies rely on real-time data to release the Air Quality Index and activate emergency responses; epidemiologists use concentration data to analyze the links between air pollution and respiratory and cardiovascular diseases; government authorities identify pollution sources and measure governance outcomes accordingly; the general public accesses information through portable devices and mobile apps to guide mask-wearing and outdoor activity decisions; industrial enterprises ensure regulatory compliance; and urban planners leverage the data to assess the actual impact of greening, vehicle restrictions, and other measures on air quality.
Pros: The PM2.5 concentration indicator is intuitive and highly standardized, facilitating cross-national and cross-regional comparisons of air quality. The classification standards are clear, enabling the public to quickly understand pollution levels and take appropriate protective measures through the AQI. Measurement technologies are mature, ranging from reference gravimetric methods to automated continuous monitoring equipment, meeting diverse needs (national monitoring networks, research, and home use). Additionally, PM2.5 concentration data holds irreplaceable value for epidemiological research, public health policy formulation, and evaluating the effectiveness of air pollution control measures.
Cons: PM2.5 concentration reflects only the mass concentration of particles and cannot distinguish their chemical composition (e.g., heavy metal content, toxicity variations), even though PM2.5 from different sources may have significantly different health impacts. Rapid detection methods such as light scattering are susceptible to interference from environmental humidity, particle optical properties, and other factors, resulting in limited accuracy. Furthermore, there is often a discrepancy between PM2.5 concentration at monitoring stations and actual public exposure—indoor PM2.5 levels typically differ from outdoor levels, and individual movement patterns affect actual exposure. Single-station monitoring data cannot represent the pollution distribution across an entire city. Equipment maintenance and calibration costs are substantial, and monitoring network coverage remains inadequate in some regions, compromising data completeness and representativeness.
Legend
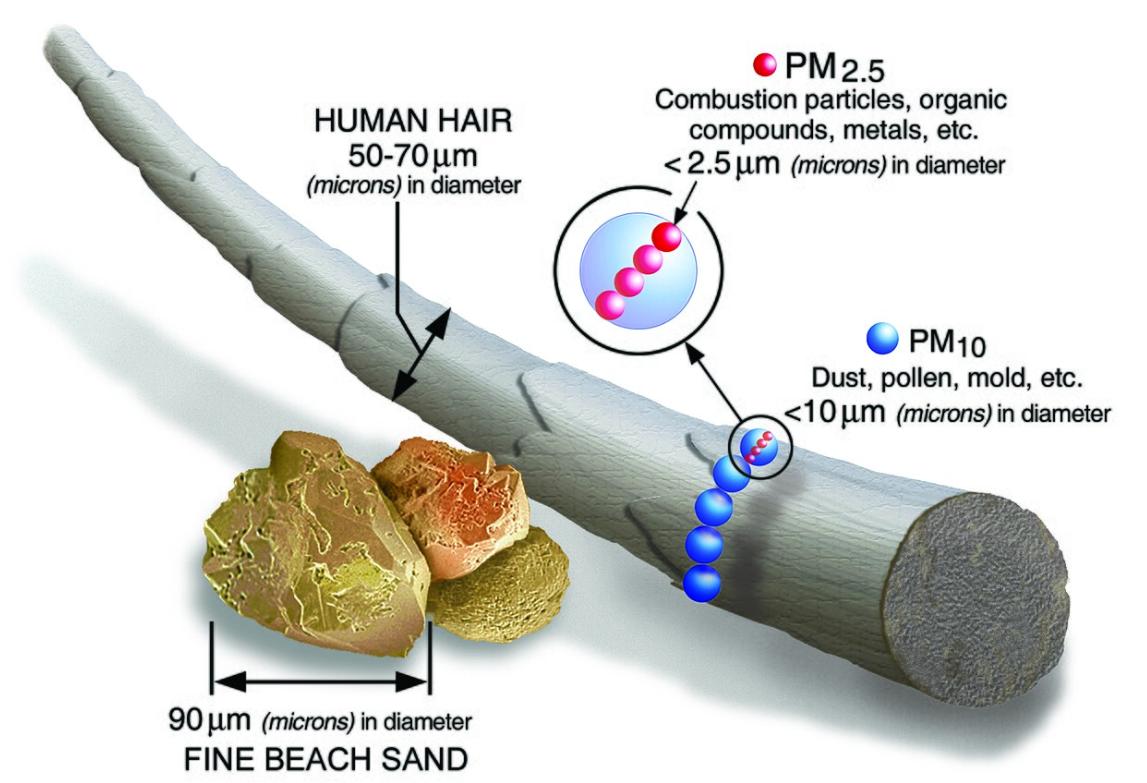
1. PM2.5 and PM10 compared with a human hair in a graphic from the Environmental Protection Agency.
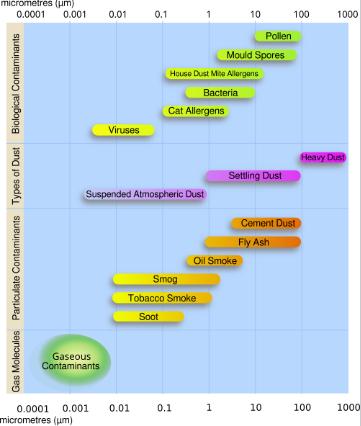
2. Types, and size distribution in micrometres (μm), of atmospheric particulate matter.
Related Article
Reference Link
https://www.stateofglobalair.org/pollution-sources/pm25
https://en.wikipedia.org/wiki/Particulate_matter
https://ww2.arb.ca.gov/resources/inhalable-particulate-matter-and-health